Transaction Patterns
SYCARDA gives business owners and managers real-time insights to transaction patterns so that they can see when and how their sales transaction happens and provide them with a valuable tool to plan.


How will you benefit from SYCARDA's Transaction Patterns module?


Business Management


Revenue Management


Outlet Management


Sales & Marketing
Related key reports


Transactions by Period
The Transaction by Period Report gives you a comprehensive breakdown of transactions of your stores by hour, daily or even weekly.
Use the insights on transactions to give you powerful indicators of your store's performance for you to plan, manage and forecast resource needed for your store.
Sales Pattern by Period
Provides insights to daily and monthly sales pattern by merging sales transaction and sales amount to monitor, evaluate, analyze, and determine sales trends for your store.
Use the information to plan, manage and forecast sales productivity or even special promotions.


Basket Sales
Make quick powerful strategic decisions with an overview of basket sales or ticket size during a specified time.
Use the information to understand SKU's performance or to plan for promotions and campaigns.
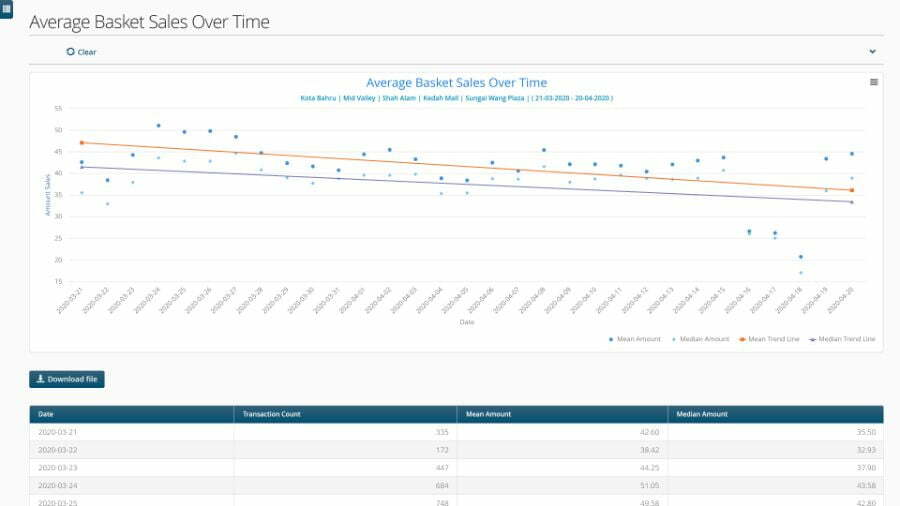
Average Basket Sales Over Time
In addition to Basket Sales view, use the Average Basket Sales Over Time to understand performance your Outlet's income over time.
Use the information to design effective business plans to entice increase customer spending, promotions or marketing campaigns and activities.


Start using your POS data to create AI-Generated BI reports
Receive in-depth business insights anytime and anywhere with SYCARDA's data analysis and business intelligence platform. Try out your free demo today!


