SKU Efficiencies
SYCARDA's near real-time monitoring of sales will enable business owners and managers to better plan their inventory based upon the sales of their SKUs. This also allows them to better stock the products that sells and streamline their inventory / offering.


How will you benefit from SYCARDA's SKU Efficiencies module?


Business Management


Revenue Management


Procurement Management


Sales & Marketing
Related key reports


SKUs Report
This report allows you to view your sales by your SKUs. You will be able to run a report based on SKUs within a specific search to make comparison of your store's performance.
This report has several views where you can view by:
1) By date range
2) By Location type (city, outlet, state)
3) By Location
4) By number of items displayed
5) By Display order (top, bottom, all)
6) By Type of Report (by sales value, occurrence, quantity).
7) By Category
8) By Category Type
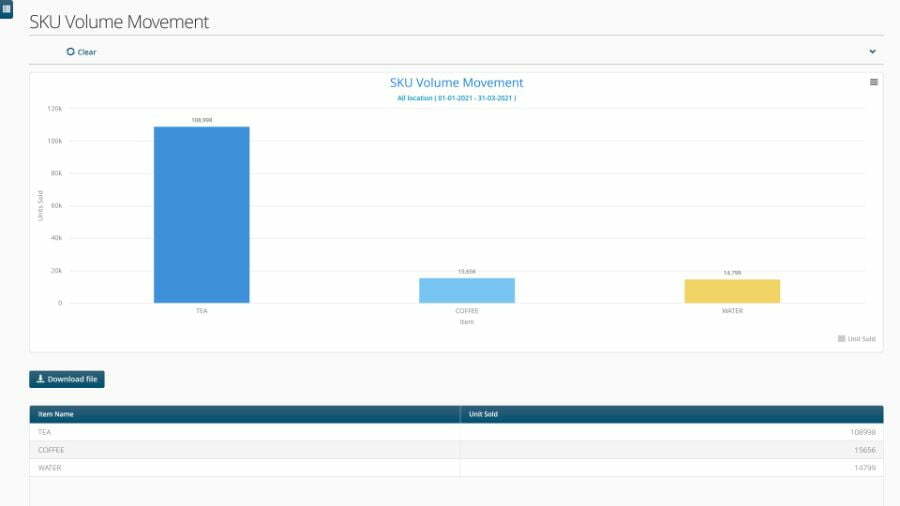
SKU Volume Movement
This report allows you to view your sales volume movement by your SKUs. You will be able to run a report based on SKUs within a specific search to make comparison of your store's performance.
This report has several views where you can view by:
1) By date range
2) By Location type (city, outlet, state)
3) By Location
4) By number of items displayed
5) By Display order (top, bottom, all)
5) By Type of Report (by sales value, occurrence, quantity).
6) By Category
7) By Category Type


SKU Historical Sales
This report allows you to view historical sales by your SKUs. You will be able to run a report based on SKUs within a specific search to make comparison of your store's performance or find out your best-selling items.
This report has several views where you can view by:
1) By date range
2) By Location Type (city, outlet, state)
3) By Location
4) By item search keyword(s)
5) By Advance search
Related Items Purchased
This report gives insights into the purchases made for various items in your stores. Pairing related items information helps you to effectively plan your purchasing decisions or effectively plan store promotions.
More than that, know your customers choices better and increase sales for your stores.
This report has several views where you can view by:
1) By date range
2) By Location Type (city, outlet, state)
3) By Location
4) By item search keyword(s)
5) By Advance search


Start using your POS data to create AI-Generated BI reports
Receive in-depth business insights anytime and anywhere with SYCARDA's data analysis and business intelligence platform. Try out your free demo today!


